Energy Management Dashboard
Enabling Data Driven Decisions for Energy Suppliers
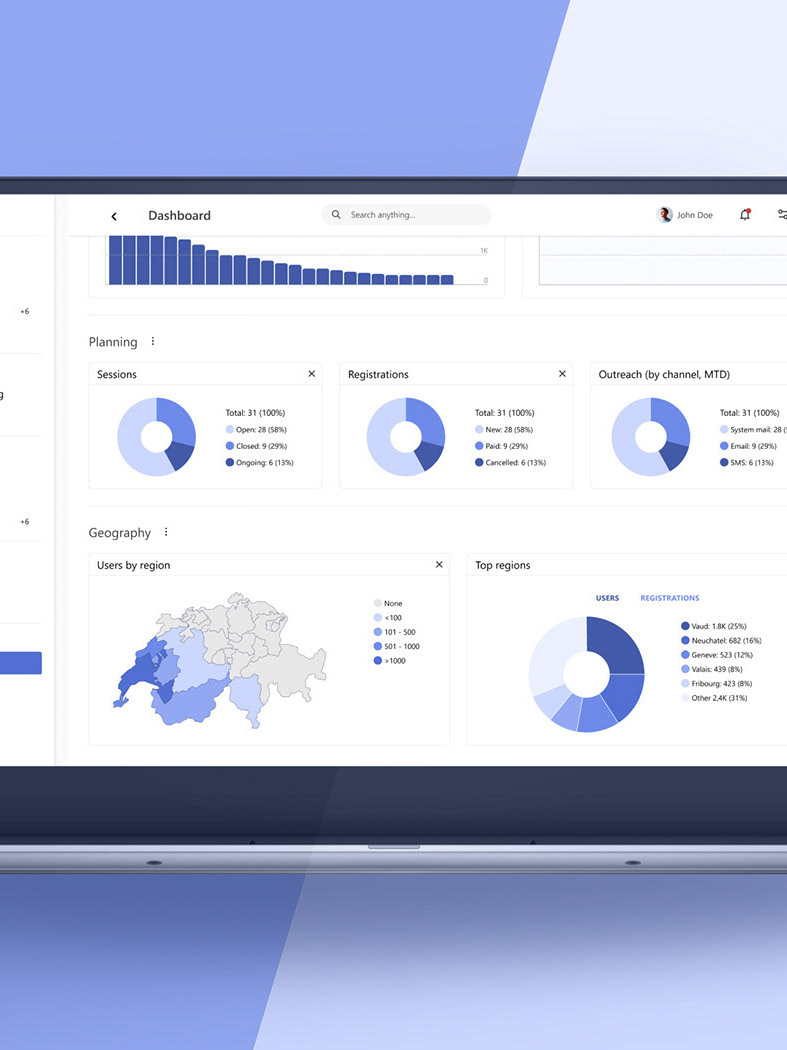
This data visualization project is commissioned by Yverdon Énergies - a public company that delivers electricity, gas and drinking water. The company operates in and around Yverdon-les-Bains, the second largest town in the Swiss canton of Vaud.

Charting Consumption From All Sources
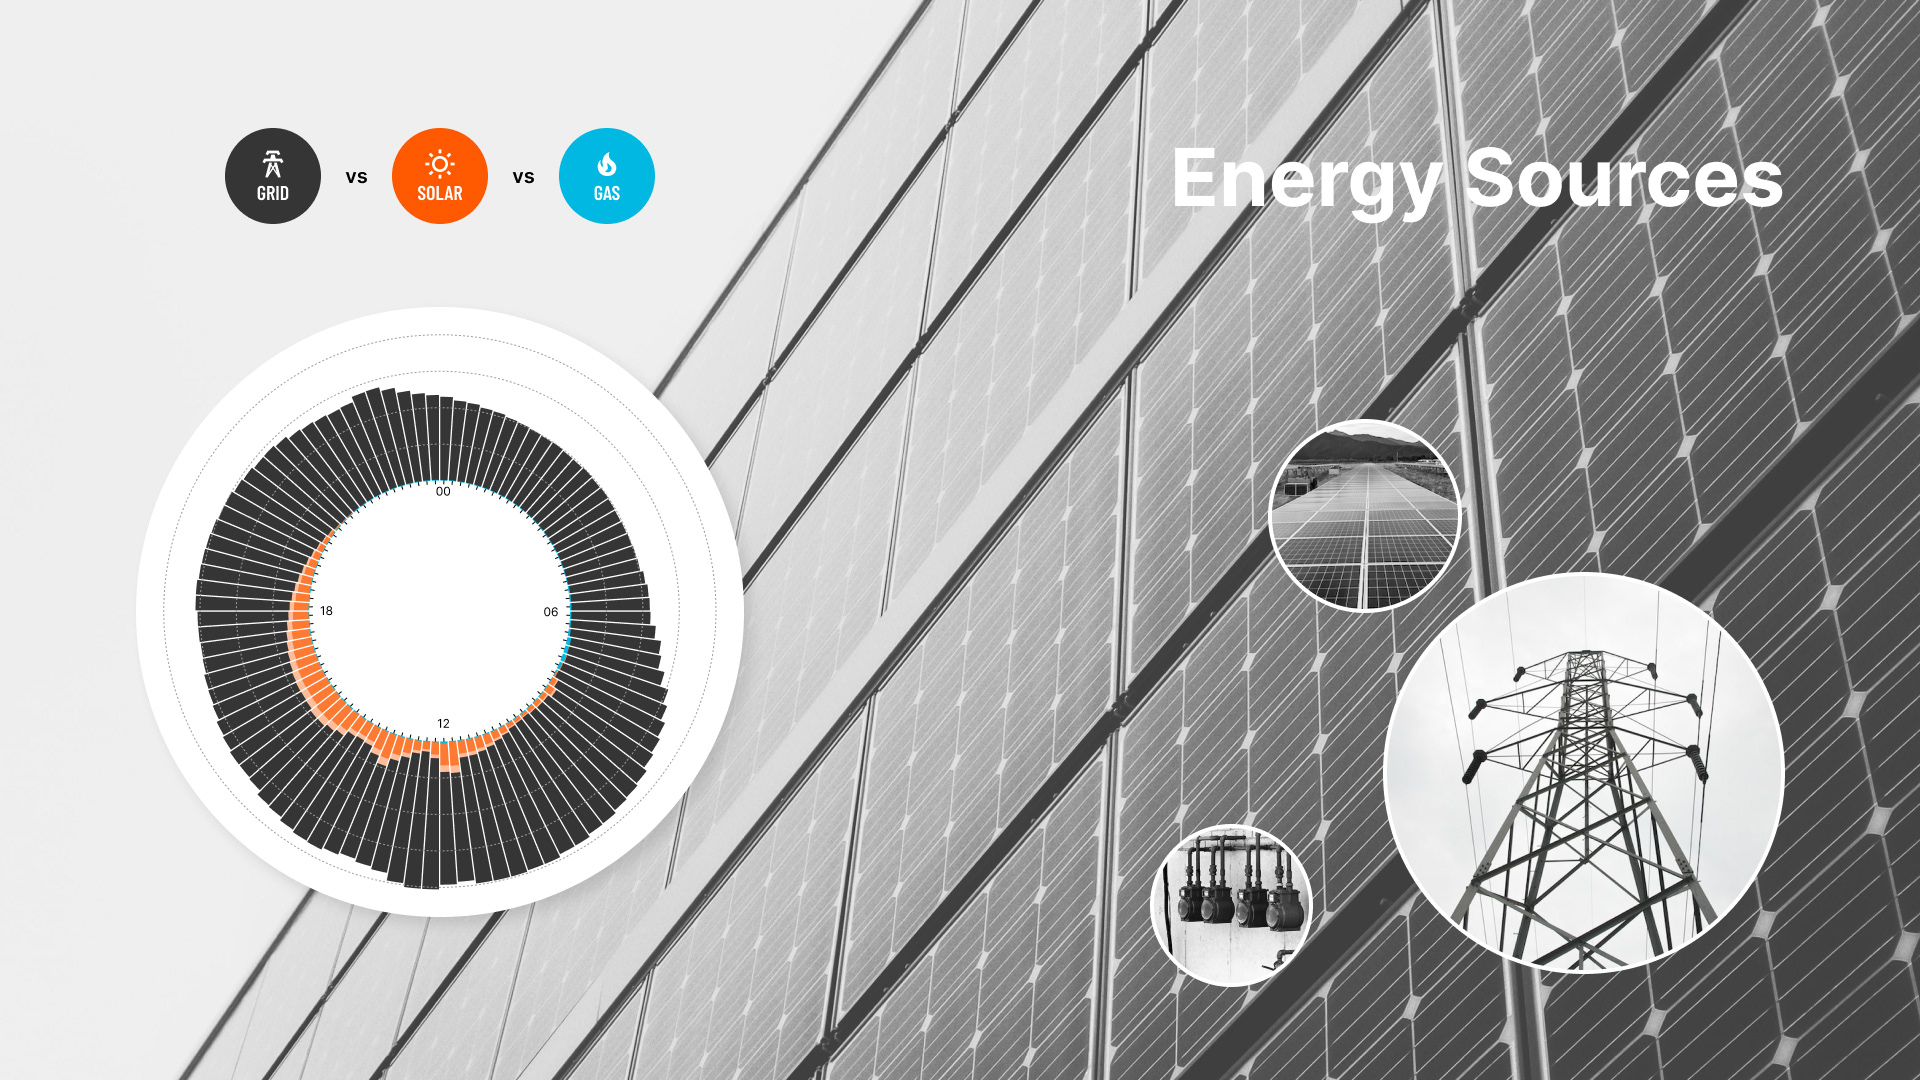
Our charts display energy consumption from the power grid, local renewable sources (solar), and gas supply (in CCM). Overlaid together, the data illustrate the energy consumption of nearly 30 000 residents, along with small businesses and industry, over time increments as small as 15 minutes.
Grid Load & Renewable Intermittency
We overlay production and consumption from local solar capacity against the power purchased from the grid. This enables engineers to keep track of the balance in the energy mix. We represent single dates (24 hrs) on radial bar charts, and continuous periods on stacked bar charts.
Solar Panel Output and the Weather
We source weather forecast data from MeteoSuisse via API. Then we calculate projected solar panel output based on the expected amount of sunlight. The forecast is limited to six days ahead, as further predictions become less reliable. The data is used to assist in the fine tuning of purchases via the grid.